|
3rd Quarter 2003 |
Economic Value of Equity (EVE) at Risk continues to Rise
|
||||
|
|
 As the saying goes, ôEarnings is kingö. Todayĺs volatile interest rate
environment has changed the banking industryĺs earnings landscape. On one
hand, with securities gains and fee income leading the way, the
industry-wide net income level as of September 2003 was at a record high for
the third consecutive quarter. On the other hand, given the combined effects
of dramatically lower short-term rates, incredibly high prepayment speeds,
and despite increased loan demand, net interest margins have been squeezed.
By the end of September 2003, the average net interest margin for the
industry reached a 12-year low. As the saying goes, ôEarnings is kingö. Todayĺs volatile interest rate
environment has changed the banking industryĺs earnings landscape. On one
hand, with securities gains and fee income leading the way, the
industry-wide net income level as of September 2003 was at a record high for
the third consecutive quarter. On the other hand, given the combined effects
of dramatically lower short-term rates, incredibly high prepayment speeds,
and despite increased loan demand, net interest margins have been squeezed.
By the end of September 2003, the average net interest margin for the
industry reached a 12-year low.
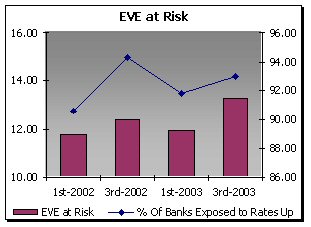
Changes in interest rates not only impact a bankĺs earnings, they also impact a bankĺs equity value. We can measure this exposure by calculating an institutionĺs Economic Value of Equity (EVE) at Risk. EVE at Risk is a long-term measure of interest rate risk. It focuses on the value of the bank in todayĺs market rate environment and that valueĺs sensitivity to changes in market rates. (See side bar for a discussion of EVE.) The level of EVE at Risk for banks has increased for the past several quarters. In September 2003 the average EVE at risk for the industry was -13.28% up from -11.78% in March 2002. The number of banks whose EVE at Risk occurs in a rising rate environment (i.e. EVE exposed to rates up) is also increasing. In March 2002 the percentage of banks whose EVE was exposed to rising rates was 90.59%. This number was up 2.33% by September 2003 to 92.93%. There are two main reasons for these increases. First, there has been a tremendous amount of turnover in banksĺ security and loan portfolios and all new purchases are at new rates in this low interest rate environment. And second, banks have been extending the maturity terms of their portfolios to reach for higher returns. Both low rates and longer terms create added risk exposure to rising interest rates.
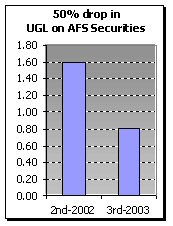
Indeed it has. The lower market value to equity ratios are illustrated dramatically by the level of unrealized gain/loss (UGL) in a bankĺs available-for-sale (AFS) securities portfolio. In just one calendar quarter this measure was cut in half. In June 2003 UGL on AFS securities was 1.60%, by September 2003 it was down to 0.80%. ôThe overall adjustment to equity for unrealized gains is beginning to erode. At some point the cushion may be gone,ö says Williams. In general, as rates rise, values fall, and these changes will have a negative impact on equity. Stretching the term
Industry data shows that by stretching their security durations, banks have lengthened their overall asset duration. In December 2002 total securities duration was 2.6 years and total asset duration was 1.8 years. By September 2003 total asset duration had been pushed out to 1.9 years. In contrast, over the same time frame, total liability duration remained basically unchanged at 1.3 years. This widening duration gap is a good indicator of increased EVE at risk. What lies ahead?
ôFor right now there are clues in the futures market which suggest a belief that the Fed will keep the federal funds rate close to the 1% current target through most of the first half of next year,ö says Hein. ô[But] the yield curve is very steep and upward sloping. Although itĺs been that way for over a year now, in general it suggests that we will see rates rising.ö Are you prepared? With the data and tools available today are you adequately assessing your interest rate risk? Indications are that market rates will begin to rise again. The questions are when, by how much, and how fast will rates rise? Is your bank positioned for rising rates? If not, how quickly can you reposition so that your bank can withstand a change in equity value? |
|
This
A/L BENCHMARKS Industry Report article was published |
 Resetting the portfolio
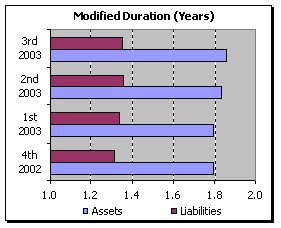 While duration doesnĺt specifically measure interest rate risk, it does
give some insight into the level and magnitude of risk. The inherent
mismatch between the duration of a bankĺs assets and its liabilities can
help determine the exposure the bankĺs EVE has to changes in interest rates.
Banks with longer-term assets funded by shorter-term liabilities will
generally have a duration gap that is positive. This means the EVE of a bank
in this situation is likely to decline if interest rates rise. The greater
the duration gap, the more exposed the bankĺs EVE is to rising rates.
While duration doesnĺt specifically measure interest rate risk, it does
give some insight into the level and magnitude of risk. The inherent
mismatch between the duration of a bankĺs assets and its liabilities can
help determine the exposure the bankĺs EVE has to changes in interest rates.
Banks with longer-term assets funded by shorter-term liabilities will
generally have a duration gap that is positive. This means the EVE of a bank
in this situation is likely to decline if interest rates rise. The greater
the duration gap, the more exposed the bankĺs EVE is to rising rates. 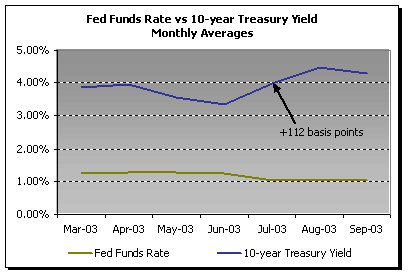 The average quarterly long-term yield curve rate moved up over 50 basis
points in one quarter, from 4.30% in June 2003 to 4.87% in September 2003.
The most dramatic shifts occurred in the 10-year treasury yield which jumped
from 3.33% in June 2003 to 4.45% in August 2003, a movement of +112 basis
points.
The average quarterly long-term yield curve rate moved up over 50 basis
points in one quarter, from 4.30% in June 2003 to 4.87% in September 2003.
The most dramatic shifts occurred in the 10-year treasury yield which jumped
from 3.33% in June 2003 to 4.45% in August 2003, a movement of +112 basis
points.