|
2nd Quarter 2004 |
It’s Fifty-Fifty, your funding source is the deciding factor
|
||||
|
|
 According to the FDIC’s Quarterly Banking Profile for the 2nd quarter of
2004, 52% of banks reported improved net interest margins, but narrower
margins at larger institutions caused the industry average to fall by 4
basis points. This is an interesting split, given that the Fed and some
industry analysts believe that, “many banks…are either interest-rate neutral
or are positioned to benefit from rising rates.”1 According to the FDIC’s Quarterly Banking Profile for the 2nd quarter of
2004, 52% of banks reported improved net interest margins, but narrower
margins at larger institutions caused the industry average to fall by 4
basis points. This is an interesting split, given that the Fed and some
industry analysts believe that, “many banks…are either interest-rate neutral
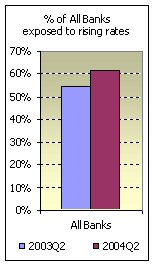
or are positioned to benefit from rising rates.”1The behavior of net interest margins should not come as a surprise given the A/L BENCHMARKS peer data for net interest earnings at risk. Over the past several years there has been almost an even split between the percentages of banks positioned to benefit from rising rates versus those whose margins may suffer. A/L BENCHMARKS measures this exposure by measuring net interest earnings at risk which is a short-term measure of interest rate risk (see discussion at the end). As of June 30, 2003 the percentage of banks expecting a decrease in margin in the face rising rates was 54%. One-year later as of June 30, 2004 that number is up only slightly to 61%. There are two major factors that play a role in determining a bank’s net interest margin over the next 12 months. The first is obviously the rise in market interest rates. The second is a bank’s funding mix. Is the bank traditionally funded by core deposits and small CDs, or does it rely on non-core funding like brokered deposits and borrowings? Rates are rising, the yield curve is flattening
Over the same time frame, long-term rates have moved only slightly. The 10-year and 20-year rates actually dropped -6bp and -12bp respectfully since December 2003. The net effect of these changes to short-term and long-term rates is a change in the shape of the yield curve. After a long period of historically low short-term rates, the yield curve is finally beginning to flatten. Funding sources appear to make a difference Larger banks, those between $1B and $10B in total assets, show much different exposures to rising interest rates depending on their source of funding. From June 30, 2001 to June 30, 2004 the percentage of traditionally funded larger banks exposed to rising rates has remained nearly the same moving from 70% to 67%. However over the same time frame, the percentage of non-core funded larger banks at risk to rising rates moved from 82% down to 61%.
Also, as a rule, big banks have more flexibility when it comes to non-core funding. Larger banks characteristically have non-core funding equal to about 25% of their total assets. By contrast, smaller institutions (those under $100M) often have less than 15%. Larger banks are locking into lower-priced longer-term debt thereby limiting the increase to their overall cost-of-funds as rates rise. Smaller banks, those less than $100M in total assets, show different exposures to rising interest rates depending on their source of funding, but the exposure is clearly different from what we see in larger banks. From June 30, 2001 to June 30, 2004 the percentage of traditionally funded smaller banks exposed to rising rates increased significantly from 32% up to 62%. However over the same time frame, the percentage of non-core funded smaller banks exposed to rising rates remained about the same, moving only from 49% to 58%. Smaller banks differ from larger banks in that their business depends on personal relationships with depositors and creditors. Core deposits-- checking, savings and small-time deposits--are the primary funding sources of community banks. 2 These traditional sources of funding are more difficult for community banks to attract and retain because regional and national banks, credit unions and capital markets are competing more aggressively for these deposits. 2 As a result, smaller banks are more compelled to raise deposit rates as market interest rates rise. This pressure on margin from rising core deposit rates has been exacerbated by another recent market trend. Over the past several years money has been moving out of CDs and into transaction accounts. In December 2000 CDs’ share of deposits was 48%. By March 2004, the share had decreased to less than 42%. This situation creates a unique problem as one analyst describes, “there is such a thing as having too many core deposits…they can easily flow into other investments.” Small CDs would give a bank better control of their funding costs as interest rates rise. 3 It’s all up from here Most experts agree that the economy is experiencing a recovery and that banks should encounter, among other things, a healthy increase in commercial loan demand. Such growth will accelerate the need for more funding. How have you chosen to fund your bank? Are you positioned to take advantage of rising interest rates? Or as short-term funding costs increase, will your net interest margin be adversely impacted? Earnings-at-Risk Short-Term view of IRR By most definitions, accounting or otherwise, when we communicate something as short-term, we usually refer to a time frame of one year or less. When measuring interest rate risk from an earnings perspective, this same concept applies. Short-term interest rate risk is measured by initially establishing a one year earnings forecast. This base forecast assumes that both the level and structure of market rates of interest are held constant from the last historical period. The balance sheet, in terms of overall size and mix, is constructed using a managerial forecast or a projection. Interest rate risk is a measure of possible loss caused by interest rate changes. Therefore the model introduces two instantaneous, parallel "shocks" to the base set of rates (common practice is to use +/-200bp movements) and then re-computes the expected earnings. The Earnings-at-Risk is the largest negative change between the base forecast and one of the "shock" scenarios. The measure is usually stated as a percentage change of either net interest income or net income. For a given bank there are two significant characteristics of the earnings-at-risk measurement. The first is determining what rate shock, up or down, produced the worse case change. This answers the question, is the bank exposed to rising or falling rates? The second is the amount projected change (or magnitude of risk). This helps answer the question, how much exposure is there? 1. Testimony on Tuesday, April 20th, Federal Reserve Board Chairman Alan Greenspan 2. “Down but not out, the future of community banks”, The Regional Economist, October 1999, Federal Reserve Bank of St. Louis. http://www.stlouisfed.org/publications/re/1999/d/re1999d3.html 3. “As Funding Source, CDs Keep Fading”, American Banker, Tuesday, August 31, 2004 Thompson Corporation |
|
This
A/L BENCHMARKS Industry Report article was published |
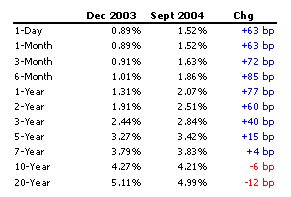 This recent tightening by the Fed has spurred a movement in short-term
yield-curve rates as evidenced by the change in the 1-Month, 3-Month, and
6-Month points on the treasury yield-curve. From December 2003 to September
2004 each rose by more than 60bp, with the 6-Month showing the greatest
change of +85bp.
This recent tightening by the Fed has spurred a movement in short-term
yield-curve rates as evidenced by the change in the 1-Month, 3-Month, and
6-Month points on the treasury yield-curve. From December 2003 to September
2004 each rose by more than 60bp, with the 6-Month showing the greatest
change of +85bp. 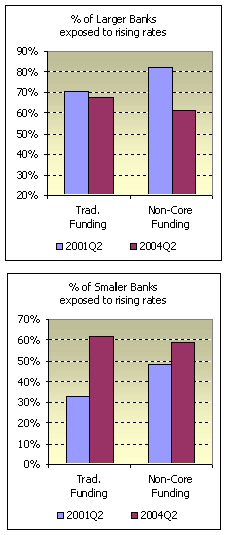 Typically larger banks can contain the costs of traditional funds much
more easily than smaller community banks. One major reason is that the
industry has been flush with cash over the past several years. With such a
large supply available, larger banks are unwilling to raise their deposit
rates too much.
Typically larger banks can contain the costs of traditional funds much
more easily than smaller community banks. One major reason is that the
industry has been flush with cash over the past several years. With such a
large supply available, larger banks are unwilling to raise their deposit
rates too much.