|
Earnings-at-Risk
Short-Term view of IRR
By most definitions, accounting or otherwise, when we
communicate something as short-term, we usually refer to a time frame
of one year or less. When measuring interest rate risk on an earnings
perspective, this same concept applies. Short-term interest rate risk
is measured by initially establishing a one year earnings forecast.
This base forecast assumes that both the level and structure of market
rates of interest are held constant from the last historical period.
The balance sheet, in terms of overall size and mix, is constructed
using a managerial forecast or a projection.
IRR is a measure of possible loss caused by
interest rate changes. Therefore the model introduces two
instantaneous, parallel "shocks" to the base set of rates (common
practice is to use +/-200bp movements) and then re-computes the
expected earnings. The Earnings-at-Risk is the largest negative change
between the base forecast and one of the "shock" scenarios. The
measure is usually stated as a percentage change of either net
interest income or net income. |
A long-time advisor and former board member of our firm used to be CFO of a
large bank in nearby Baltimore, Maryland. That was back in the 1970’s. He
says, “Back then our Chairman would always ask the same question after I
presented the budget and the projected net interest margin, ‘So what happens
when interest rates go up…or down?”
Bank management teams across the country are still asking the same
question today. Only now we have a name for it, we call it Interest Rate
Risk. We also have better ways to measure and monitor it, thanks to the
increased availability of data and more powerful technology.
Observing history
Recently it seems like rates have been low for so long, that it’s hard to
imagine a dynamic market rate environment. From June 30, 2002 to June 30,
2003 Fed Funds had only moved down 50bp from 1.75% to 1.25%. However over
the same time frame the treasury yield curve changed quite a bit.
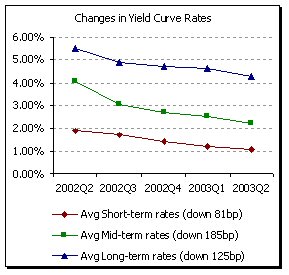 The most significant change occurred in mid-term rates (those rates
between 1 and 10 years). Mid-term rates went from an average of 4.08% down
to 2.22%, a change of over 180bp. Long-term rates moved in a similar
fashion, moving from an average of 5.55% down to 4.30%, a shift down of
125bp. Movements on the short end of the curve were much closer to the
change in fed funds with short-term rates dropping 81bp from 1.89% down to
1.09%. The most significant change occurred in mid-term rates (those rates
between 1 and 10 years). Mid-term rates went from an average of 4.08% down
to 2.22%, a change of over 180bp. Long-term rates moved in a similar
fashion, moving from an average of 5.55% down to 4.30%, a shift down of
125bp. Movements on the short end of the curve were much closer to the
change in fed funds with short-term rates dropping 81bp from 1.89% down to
1.09%.
Margin has suffered
This falling rate environment has taken its toll on the banking industry
over the past four quarters. In fact, the headline in the FDIC’s Quarterly
Banking Profile for March 31, 2003 was “Net Interest Margins Continue to
Narrow” and the headline for June 30, 2003 was “Net Interest Margins Remain
Under Pressure.”
In March 2003 the FDIC reported that “the average net interest margin…was
3.80 percent, 26 basis points lower than a year earlier. Among institutions
with less than $100 million in assets…the average net interest margin has
fallen by 7 basis points in the last four quarters; at larger institutions,
the margin decline over this period has averaged 27 basis points.”
This downward pressure continued into June for larger banks. The average
margin fell from 3.79 down to 3.72. The FDIC also reported that, “more than
half of all institutions – 51.4% - saw their net interest margin decline in
the second quarter.”
Back to the original question
Given that market rates have fallen and interest margins have suffered,
let us come back to the original question. What will happen to interest
margin if market rates change?
One of the best ways to learn how changing rates will affect net interest
margin is to use an interest rate risk (IRR) model like A/L BENCHMARKS.
Models like this typically measure IRR by examining Net Interest Earnings at
Risk (a.k.a. Margin at Risk, see side bar for an explanation). The goal of
such a process is to predict what percentage changes in margin will occur as
a result of either an increase or a decrease in market interest rates.
Rewind
To help answer the original question, it is helpful to look at some industry
peer information. The A/L BENCHMARKS industry peer database has
Margin-at-Risk information for the industry as far back as 1996.
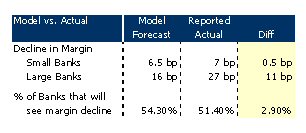 Peer data from one year ago (June 30, 2002) showed that banks with less
than $100 million in total assets had 1.5% of their margin at risk given a
rate shock down. This equates to a decrease of about 6 ˝ basis points if
rates fall. Larger banks showed a decrease of 3.9%, or 16 basis points,
given a rate shock down. These numbers seem consistent with the actual
industry performance reported by the FDIC (see table for a comparison). Peer data from one year ago (June 30, 2002) showed that banks with less
than $100 million in total assets had 1.5% of their margin at risk given a
rate shock down. This equates to a decrease of about 6 ˝ basis points if
rates fall. Larger banks showed a decrease of 3.9%, or 16 basis points,
given a rate shock down. These numbers seem consistent with the actual
industry performance reported by the FDIC (see table for a comparison).
The FDIC also reported that roughly half (51.4%) of all banks showed a
decline in net interest margin from March 31, 2003 to June 30, 2003. Again
this seems consistent with what the A/L BENCHMARKS peer data predicted last
quarter. The March 31, 2003 peer data showed that 3319 banks out of 6114
(54.3%) were exposed to falling rates. Such results show that the A/L
BENCHMARKS model, and its peer data, can reasonably project what will happen
to a bank’s margin when market rates change.
Look ahead, and prepare
Today, most of the industry believes that market rates will begin to rise
within the next year. However, we are all aware that there is no guarantee.
In fact if we look at treasury yield curve data over the past several years,
we find data that might support a rate movement either way.
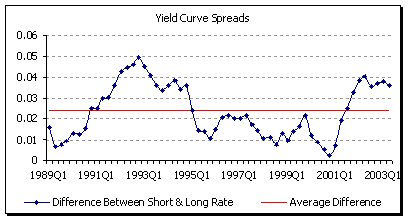 The graph shows the average spread between the long and short points on
the yield curve from March 1989 until June 2003. The average spread over
that time frame was 2.37%. The spread as of June 2003 was 3.61% down from
3.80% in March. This data might suggest that the curve is still too steep.
If that’s the case long rates must come down (again) or short rates must
rise. On the other hand, perhaps this data only tells us what we already
know, that market interest rates will change. The graph shows the average spread between the long and short points on
the yield curve from March 1989 until June 2003. The average spread over
that time frame was 2.37%. The spread as of June 2003 was 3.61% down from
3.80% in March. This data might suggest that the curve is still too steep.
If that’s the case long rates must come down (again) or short rates must
rise. On the other hand, perhaps this data only tells us what we already
know, that market interest rates will change.
What will happen to your bank’s interest margin when market rates change?
Are you positioned to take advantage of rising rates? The June 30, 2003 peer
data suggests that over 50% of all banks are. The data and tools you need to
manage your margin are available. Is your IRR model accurately telling you
what to anticipate? |