|
1st Quarter 2002 |
Countertrend? Why are loan values dropping?
|
||||
|
|
|
At first glance total loan premium appears to be charting its own
course. Bankers understand the inverse relationship between market rates and bond values: as rates rise, values fall; and vice versa. Bank management is keenly aware of changes in the market value of their available-for-sale portfolio because such changes directly affect their equity.
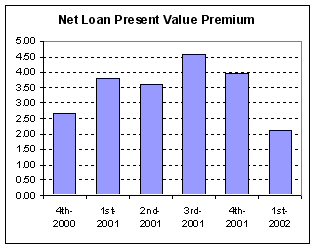
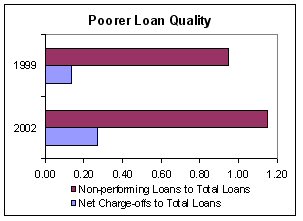
Why is loan value premium important to your bank? Because your loan portfolio consists of roughly 60-70% of your total assets. The value of this portfolio is closely related to market interest rate movements and to the credit quality of the loans. Any change in total loan portfolio value directly impacts the economic value of equity (EVE) of your institution and alters your risk position. What’s happened over the past several quarters? The Net Loan Present Value Premium began to drop in the 4th quarter of 2001 and has dropped further in the 1st quarter of this year. The Fed lowered rates twice in the 4th quarter of 2001. Since that time both the Fed discount rate and prime rate have remained level. Why don’t we see loan values rise or level off if we are in a falling rate environment? There are two primary reasons why loan values have fallen for two straight quarters. First, certain market rates have actually risen since the 4th quarter of 2001. Second, increasingly poor loan quality is beginning to show its effects. Changes in the yield curve Medium-term rates (2 to 7 years) moved in a different direction. After following the short-term trend downward throughout 2001, medium-term rates moved up nearly 60 basis points. Average medium-term rates were 3.71 in the 4th quarter of 2001, but finished the 1st quarter of 2002 at 4.30. The discount rates, which are used to determine loan present values, are tied to the duration of the bank’s loan portfolio. The average duration of bank loan portfolios is about 2 years. Since these rates have risen recently, we should expect to see a drop in loan value premiums. Poor Credit Quality Regulators have been issuing warnings about the industry’s poor credit quality for over 2 years. In fact the FDIC reports the level of non-current loans in U.S. banks for the 4th quarter of 2001 and the 1st quarter of 2002 are at their highest levels since before 1999. A/L BENCHMARKS peer data shows a comparable trend. Non-performing loans to total loans were 0.94% in the 4th quarter of 1999. By 1st quarter of 2002 non-performers reached nearly 1.15%. Net charge-offs have increased as well. In the 3rd quarter of 1999 the average charge-off was 0.14%. By the 4th quarter of 2001 that number had almost doubled, reaching 0.27%. Other underlying factors Economic Value of Equity |
|
This
A/L BENCHMARKS Industry Report article was published |
 This concept also applies to a bank’s loan portfolio. Although changes in
the overall value of a bank’s loan portfolio doesn’t have a specific
accounting impact on book equity, these changes do have a significant
influence on a bank’s Economic Value of Equity or EVE.
This concept also applies to a bank’s loan portfolio. Although changes in
the overall value of a bank’s loan portfolio doesn’t have a specific
accounting impact on book equity, these changes do have a significant
influence on a bank’s Economic Value of Equity or EVE. 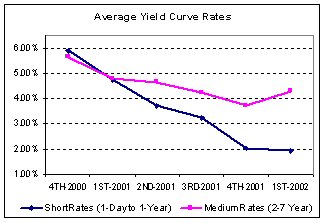 The average yield curve rate in the 4th quarter of 2000 was 5.76. That
average dropped nearly 240 basis points by the 4th quarter of 2001 when the
average rate was 3.38. This rate decrease continued into the 1st quarter of
2002 with average short-term rates (those 1-year and less) falling to 1.91.
The average yield curve rate in the 4th quarter of 2000 was 5.76. That
average dropped nearly 240 basis points by the 4th quarter of 2001 when the
average rate was 3.38. This rate decrease continued into the 1st quarter of
2002 with average short-term rates (those 1-year and less) falling to 1.91.
 Credit quality is critical in determining loan value premiums. The credit
risk component is the annualized yield needed to cover the loss of value
expected over the entire life of a portfolio. For loans, we derive this
component based on an analysis of under-performing loans and the gross
charge-off experience of the bank. As loan quality decreases, the cost, or
discount rate, increases thereby lowering the present value. Remember as the
discount rate rises, the present value falls.
Credit quality is critical in determining loan value premiums. The credit
risk component is the annualized yield needed to cover the loss of value
expected over the entire life of a portfolio. For loans, we derive this
component based on an analysis of under-performing loans and the gross
charge-off experience of the bank. As loan quality decreases, the cost, or
discount rate, increases thereby lowering the present value. Remember as the
discount rate rises, the present value falls.